Note: I do not have any background in finance and forgive many subjective inferences in this report.
Summary
This report provides an analysis of volume and return patterns, and propose some simple intra-day trading strategies for stock 600519 of China A-shares, Kweichow Moutai Co., Ltd..
Volume analysis:
Intra-day volumes follow an U shaped pattern: 600519 shows that the market open is the most liquid time of the day, and the volumes gradually decay. In addition, volumes rise up a little after the lunch break, and then decay again. Before the marked close, volumes rise up a little again. However, compared with other markets such as the U.S. and Hong Kong, the rise near the market close is not significant.
Intra-day volumes’ means are usually larger than medians.
There is no big difference in intra-day volumes among different weekdays: though different weekdays show similar patterns, volumes on Monday’s market open are slightly larger than other weekdays, but it is still within the statistical region.
Return analysis:
Quantiles of intra-day returns follow the decaying pattern toward 0.
Inter-day returns are relatively stable, remaining consistently above 0 due to overall positive returns throughout the year.
The discrepancy around specific times such as 3:20 and 6:40 may be leveraged for trading.
Trading strategies leveraging the means of the intra-day returns: Leveraging observed fluctuations in intra-day returns, several trading strategies were tested, including shorting during drops and longing during peaks.
Conclusion:
The findings check the intra-day patterns of volume and return that are similar to the patterns proposed in previous work. In addition, this report highlights the potential for exploiting intra-day return patterns to develop profitable trading strategies, emphasizing the importance of aligning strategies with observed market dynamics.
Volume Analysis
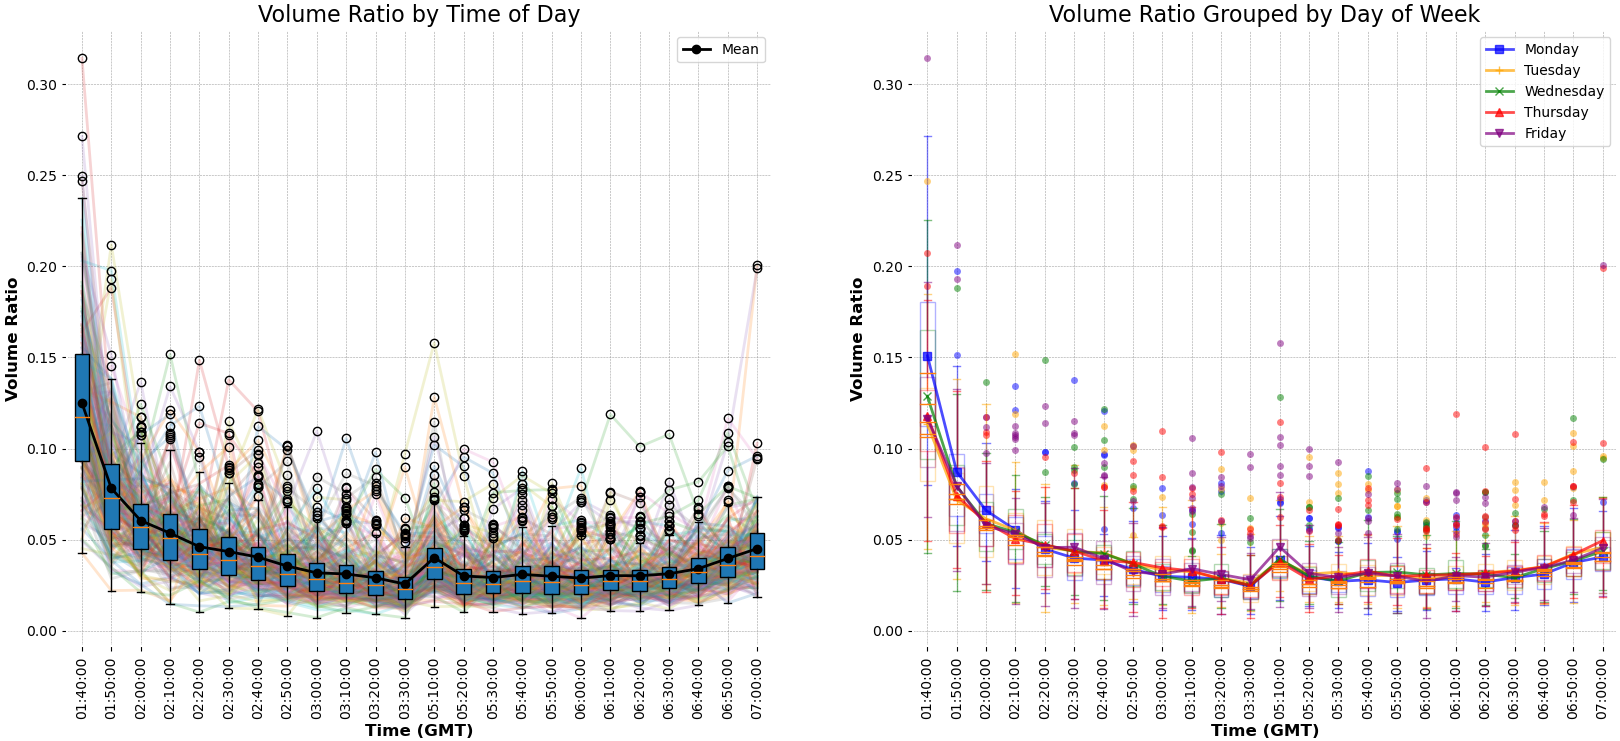
The volume distribution throughout trading hours, depicted in the graph below with intervals of 10 minutes, reveals insightful patterns.
Here are several findings regarding the distribution:
U shaped pattern: Research suggests that trading volumes typically exhibit a U-shaped pattern across various markets, a trend that is also reflected in the provided dataset. Similar to other markets, the stock 600519 experiences a substantial surge in volume at market open, gradually decaying off thereafter. However, deviations from this pattern are notable. Firstly, the increase in volume near market close is comparatively smaller than reported in literature. Some studies presented that volumes near market close can rival or exceed those observed at market open. Secondly, a minor rise is observed after the lunch break (around 5:10 as depicted in the figure). This post-lunch surge is consistent with patterns observed in A-share and Hong Kong markets presented in the papers below, but is absent in the U.S. market, where trading continues uninterrupted throughout the day.
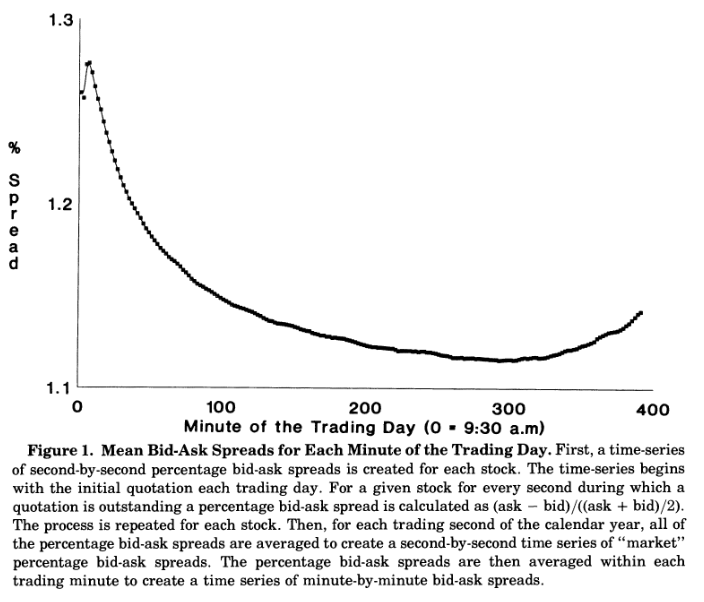
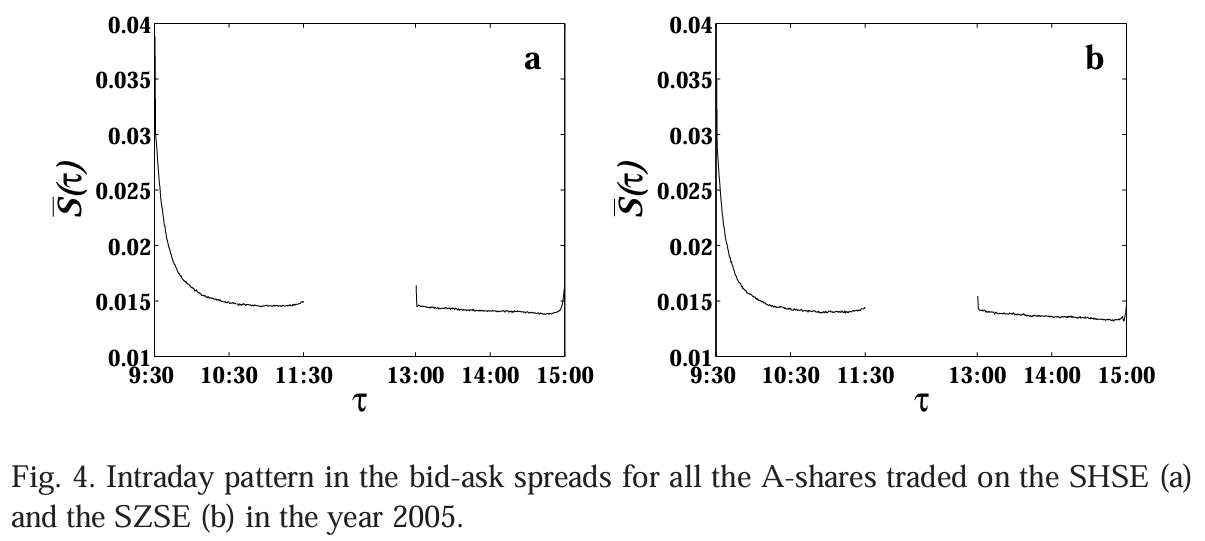
When I was reviewing papers, I found that the U shaped pattern has mainly two different shapes depending on the behavior close to the market close time. Several papers presented that the rise close to the market close is relatively small, such as figures below:
{width=50%}
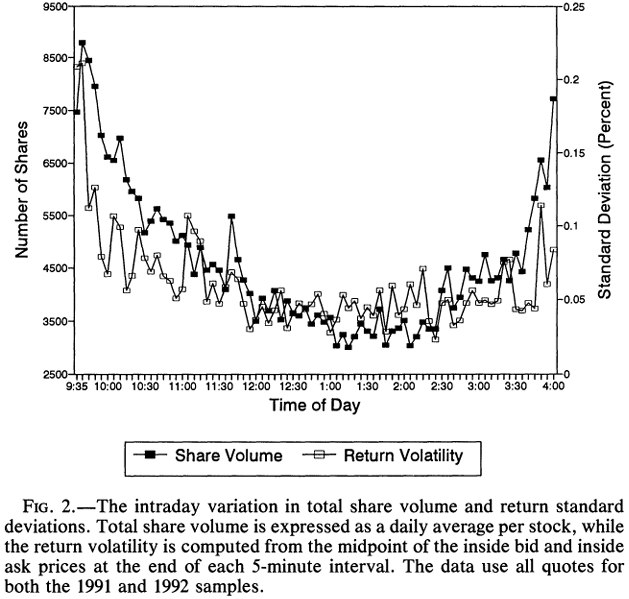
NYSE stocks. Figure from [1].
A share. Figure from [2].
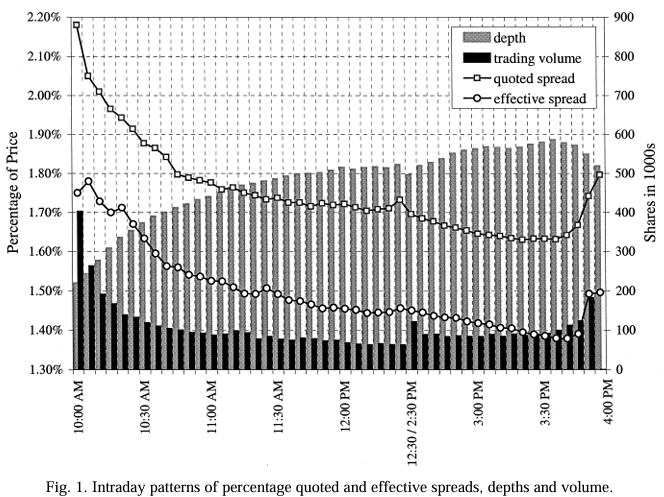
Whereas there are several other papers presented a higher rise in the end:
Hong Kong. Figure From [3].
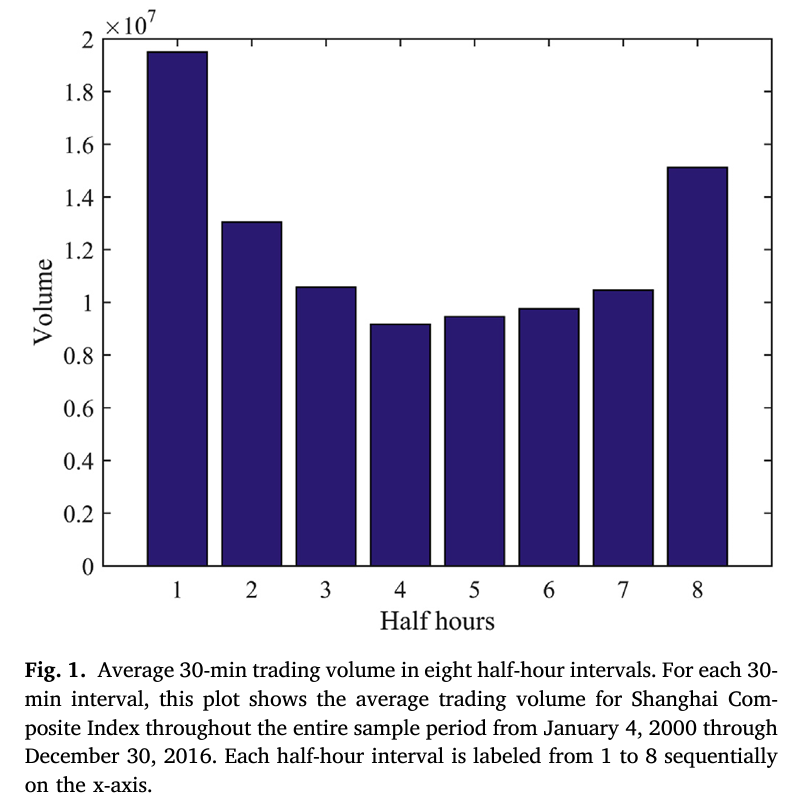
Shanghai Composite Index. Figure from [4].
NASDAQ. Figure from [5].
SPY ETF. Figure from [6].
The U-shaped pattern observed in intra-day volumes is a common phenomenon in financial markets and can be attributed to various factors. At the beginning of the trading day, there tends to be a surge in trading volume as investors react to overnight news, earnings reports, or other market developments. Similarly, towards the end of the trading day, there may be increased activity as investors rush to execute trades before the market closes. The small rise after lunch break can also be attributed to similar reasons. In addtion, many traders and institutional investors have specific trading strategies or patterns that they follow, which can contribute to the observed U-shaped pattern.
Mean vs. Median: The mean volumes usually surpass the median across the dataset. Notably, all means exceed the medians, with outliers predominantly situated above the upper quartile of the boxplot. When the mean is higher than the median, it suggests that there are a few unusually large volume values that are pulling the average upwards, creating a right-skewed distribution. These outliers could be the result of significant trading activity during specific periods, such as exceptional events impacting trading volume.
Day-of-Week Analysis: There are no substantial disparities observed between trading volumes across different days of the week. While volumes near Monday’s market open exhibit a slight increase compared to other days, these differences do not significantly deviate from statistical norms. The Monday’s rise may also be due to the news during weekends and other similar reasons as the rise after market opens.
Return Analysis
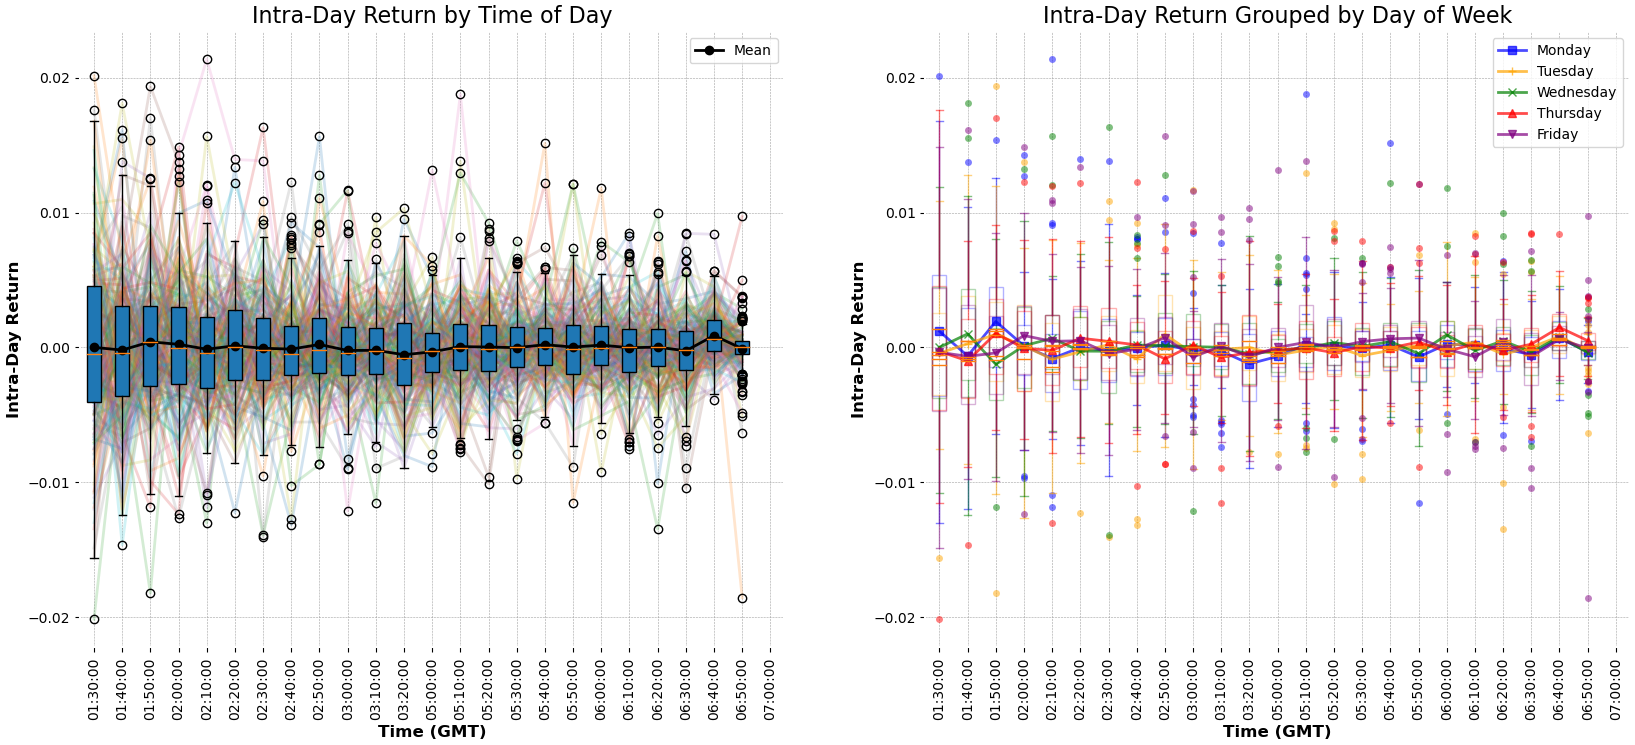
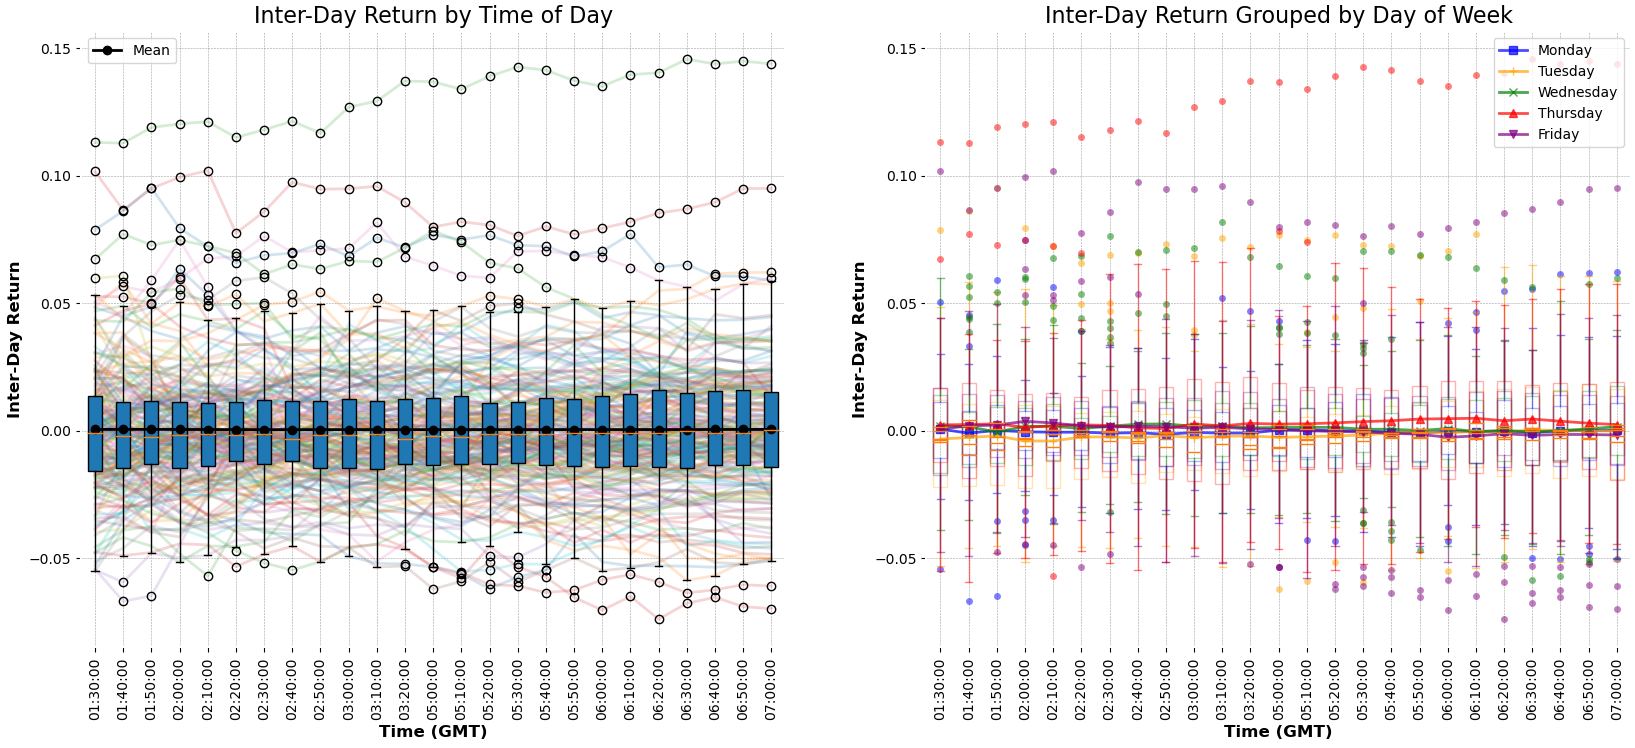
Intra-day and inter-day returns, depicted below, offer valuable insights into the stock’s performance. Intra-day returns are computed by segmenting the dataset into 10-minute intervals, considering the last price of each segment. Specifically, the return at time $T$ represents the return of buying the stock at time $T$ and selling it at $T+10\ mins$. Similarly, inter-day returns represent the returns of buying the stock today and selling it next day at the same time.
The intra-day returns exhibit a decaying pattern akin to the volume distribution. This is evident from the length of the boxplot whiskers and further illustrated in the figure below. Notably, a minor rise in return range occurs before the lunch break. However, such a pattern is not observed in inter-day returns.
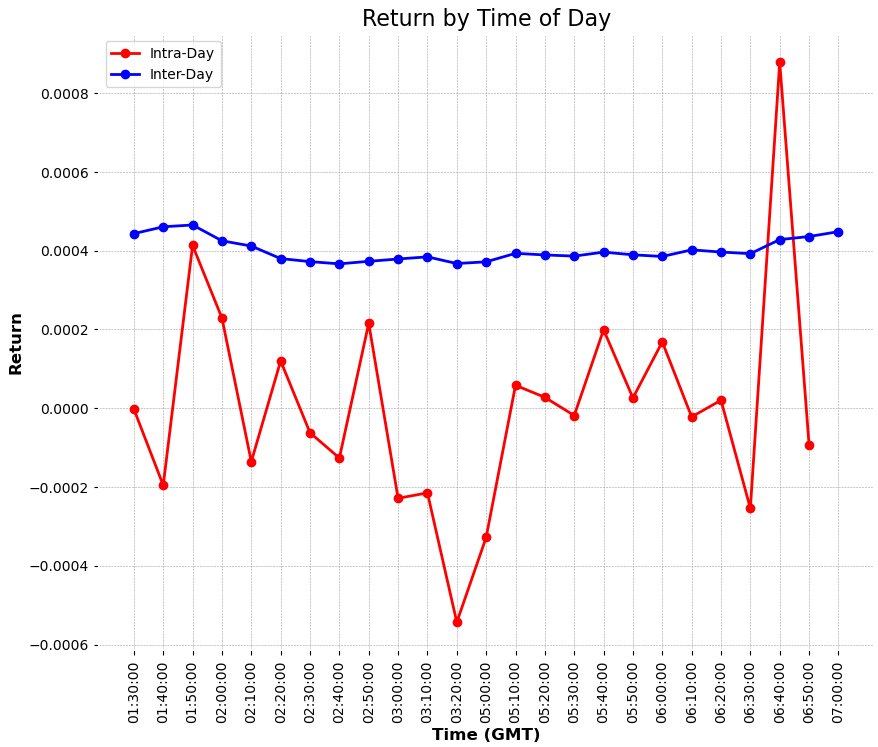
Inter-day returns demonstrate greater stability compared to intra-day returns, as depicted in the figure above. These returns consistently remain above 0, primarily due to the overall positive returns throughout the year. Conversely, intra-day returns exhibit significant fluctuations, with a notable drop at 3:20 and a peak at 6:40.
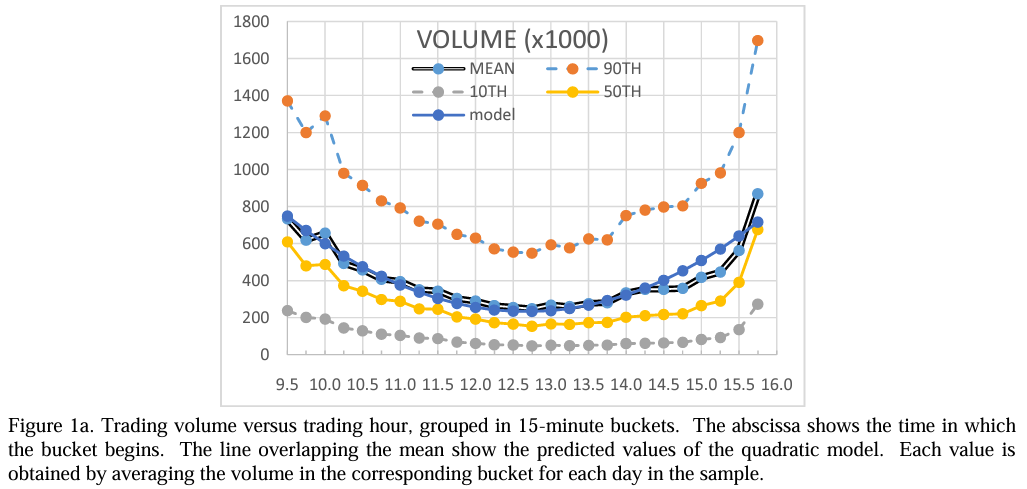
Figure from [6].
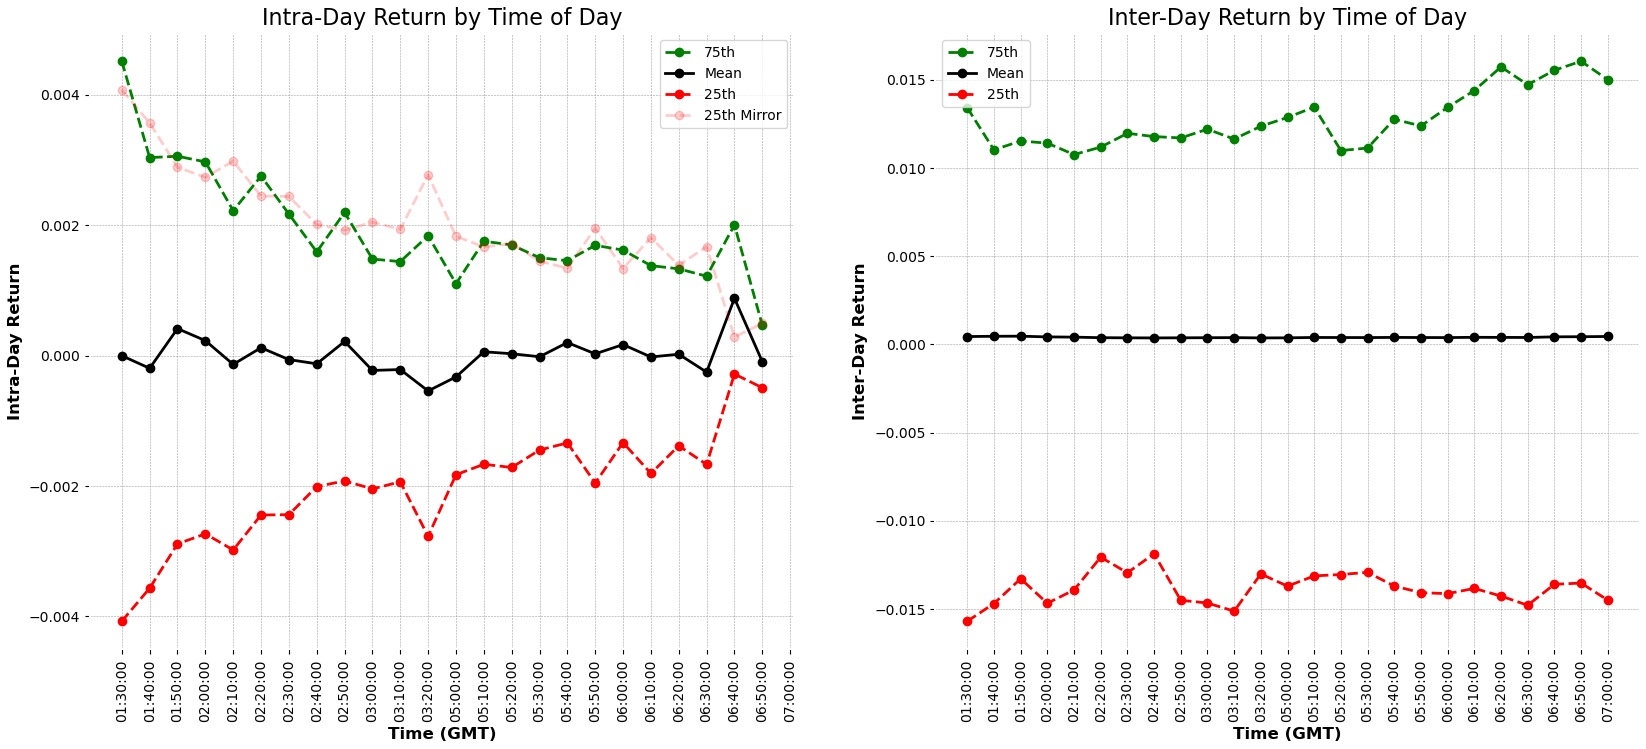
The figure from [6] illustrates that the 90th and 10th percentiles of intra-day returns exhibit a U-shaped pattern. However, such a pattern is not observed for stock 600519, where the pattern is decaying to 0 (90-th and 10-th figure does not show in this report, but it is checked). Conversely, inter-day returns remain relatively flat over time, which may suggest a lack of statistical patterns among different days at the same time.
In an ideal scenario where the stock has an equal probability of moving up or down, the two lines of the complementary quantile should be symmetrical around the zero-return (This assumption is not proved and only one of my intuitive assumptions, which may be wrong). However, significant disparities are observed at 3:20 and 6:50, corresponding to the aforementioned fluctuations, which may be leveraged for trading as shown in the next section.
Strategy
The observed discrepancies in intra-day returns at 3:20 and 6:50 present opportunities for various intra-day trading strategies. It’s important to note that this section oversimplifies trading strategies and assumes ideal conditions such as no trading limitations, taxes, or fees, unrestricted trade quantities instead of multiples of 100 in A share, T+0 is assumed to be feasible, and no constraints on short-sale.
Assume the initial money is 1000000 and hold is 0. The benchmark strategy is purchasing the stock at the opening price as many quantities as possible on the first date of the dataset and holding it until the last date.
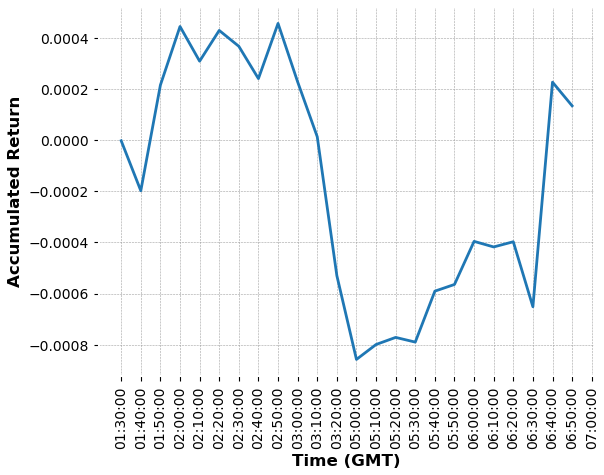
Analyzing the accumulated mean intra-day returns over time reveals significant variations between 2:50-5:00 and 6:30-6:40, corresponding to previously noted fluctuations.
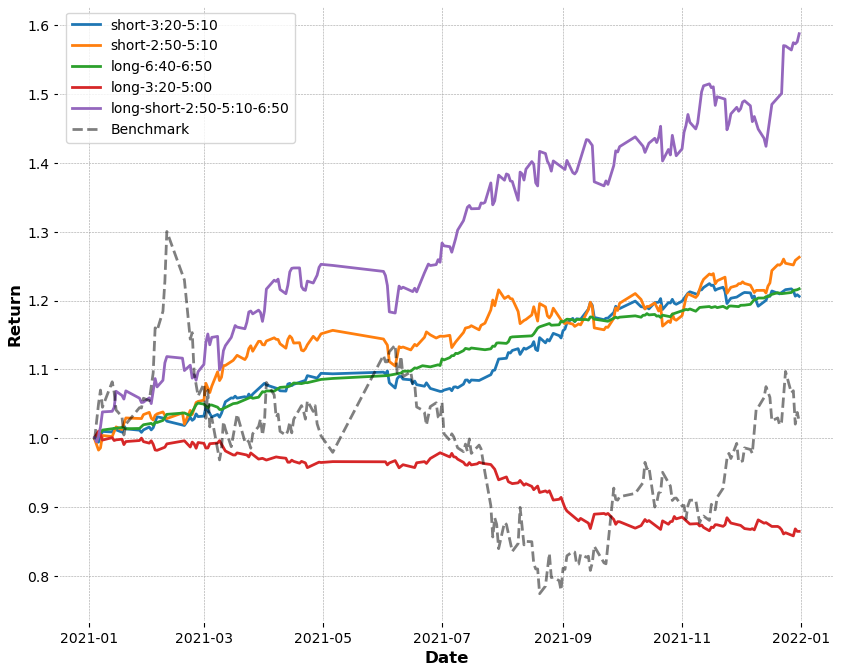
Leveraging this feature, 5 strategies are tested. These strategies perform the trading operation every day.
short-3:20-5:10: sell as many as possible at 3:20 and buy the same amount at 5:10.
short-2:50-5:10: sell as many as possible at 2:50 and buy the same amount at 5:10.
long-6:40-6:50: buy as many as possible at 6:40 and sell the same amount at 6:50.
long-3:20-5:00: buy as many as possible at 3:20 and sell the same amount at 5:00. This strategy is to show the opposite.
short-long-2:50-5:10-6:50: sell as many as possible at 2:50, buy as many as possible at 5:10, and sell the remaining at 6:50. This is the combination fo short and long.
The return of each strategy is shown below:
The overall idea is to short during the big drop in the accumulated returns, and to long during the big peak in the accumulated returns. Compared short-3:20-5:10 and short-2:50-5:10, though in the figure of accumulated return, 2:50 is much further than 3:10 from 5:10, the overall year-round return is similar. short-3:20-5:10 behaves better during the fluctuations from March to June, but worse during the fluctuations from August to October.
long-6:40-6:50 also has a similar year-round return, but it is much stable than short strategies in that the max drawdown is much smaller than the short strategies. On the other hand, long-3:20-5:00 is only to show that when trading in the opposite direction as what is found in the mean intra-day returns, the return is bad.
The strategies can be combined together to perform several operations in a day, and as expected, the combined strategy short-long-2:50-5:10-6:50 is the best and behaves like the addition of the underlying short and long strategy.
Future Work
This report is limited by the time constraints. Here I list some possibilities for future exploration:
Validation and backtesting: There are many subjective inferences in this report because my lack of finance background, such as I assume that the complimentary quantiles should be symmetric around 0 return. Also, I make many conclusions without further testing and proving, where these conclusions may be proved to be wrong under strict analysis.
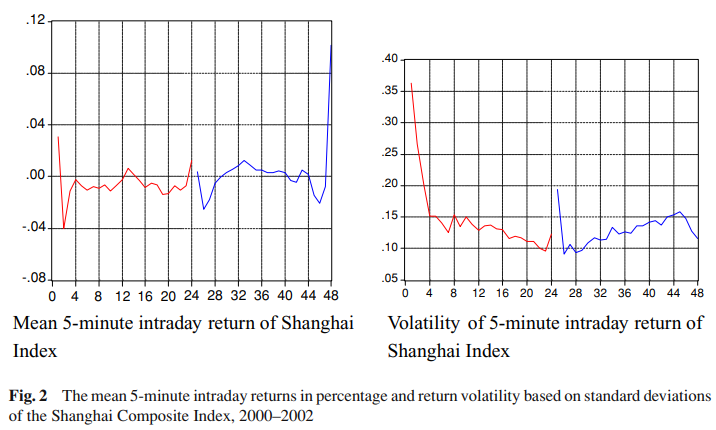
Besides, the dataset only consists of one stock and one year. Rigorous validation and backtesting of trading strategies using historical market data to assess their performance under various market conditions and ensure robustness and reliability in real-world trading environments. Interestingly, the low return after the lunch break and high return near the close time is also found in [7], which is based on Shanghai Composite Index during 2000–2002, as shown below:
Figure from [7].
Figure out the reasons behind the patterns: I do not have enough time to check papers to understand the behaviors of some findings in this report.
Analysis on other quantities: In this report, only volume and return are examined. Other quantities may be also helpful and follow some statistical patterns. For example, [7] proposes that the intra-day volatility follows an L shaped pattern.
References
[1] McInish, Thomas H., and Robert A. Wood. “An Analysis of Intraday Patterns in Bid/Ask Spreads for NYSE Stocks.” The Journal of Finance, vol. 47, no. 2, 1992, pp. 753–64. JSTOR. https://doi.org/10.2307/2329122.
[2] Ni, Xiao-Hui, and Wei-Xing Zhou. “Intraday pattern in bid-ask spreads and its power-law relaxation for Chinese A-share stocks.” JKPS 2009;54:786-791. https://doi.org/10.3938/jkps.54.786.
[3] Ahn, Hee-Joon, and Yan-Leung Cheung. “The intraday patterns of the spread and depth in a market without market makers: The Stock Exchange of Hong Kong.” Pacific-Basin Finance Journal 7.5 (1999): 539-556. https://doi.org/10.1016/S0927-538X(99)00023-2.
[4] Zhang, Yaojie, Feng Ma, and Bo Zhu. “Intraday momentum and stock return predictability: Evidence from China.” Economic Modelling 76 (2019): 319-329. https://doi.org/10.1016/j.econmod.2018.08.009.
[5] Chan, Kalok C., William G. Christie, and Paul H. Schultz. “Market structure and the intraday pattern of bid-ask spreads for NASDAQ securities.” Journal of Business (1995): 35-60. http://www.jstor.org/stable/2353082.
[6] Giudici, Emiliano and Haiying Hu. “Intraday Patterns in the Trading Volume of the SPY ETF.” International Journal of Business and Social Science (2019). https://api.semanticscholar.org/CorpusID:211782811.
[7] Tian, Gary Gang, and Mingyuan Guo. “Interday and intraday volatility: Additional evidence from the Shanghai Stock Exchange.” Review of Quantitative Finance and Accounting 28 (2007): 287-306. https://doi.org/10.1007/s11156-006-0011-x.
I am a PhD student at Yale University, and my research interests lie in quantum computing and computer security. I am currently working on quantum computer security, where I design attack and defense mechanisms on quantum computers and quantum cloud providers. I am also working on RTL design (Verilog) targeting FPGAs, where I implement Post-Quantum Cryptography (PQC) schemes that are secure under both classical and quantum computer attacks.